🤝 Opportunity Dashboard
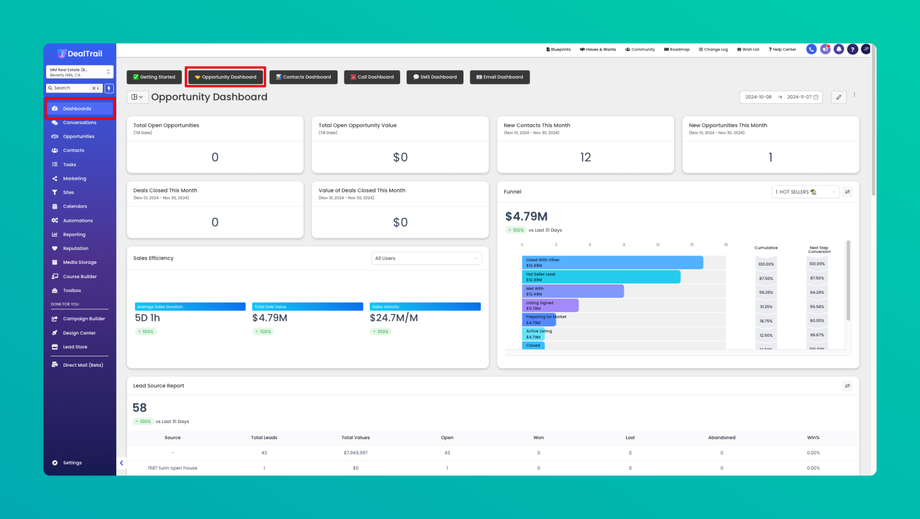
The Opportunity Dashboard provides a clear, real-time overview of your open opportunities, new leads, sales performance, and more—allowing you to make data-driven decisions to boost your sales success.
Dashboard Contents:
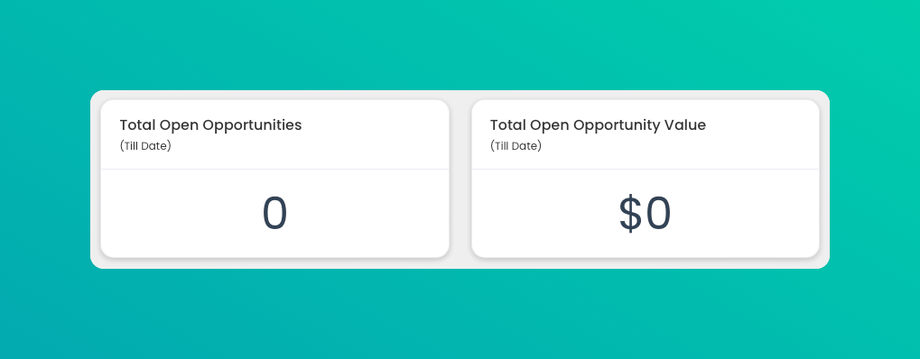
1. Total Open Opportunities and Total Open Opportunity Value
• A card showing the current count of all active opportunities in your pipeline, giving a snapshot of your current workload and deal potential as well as its value.
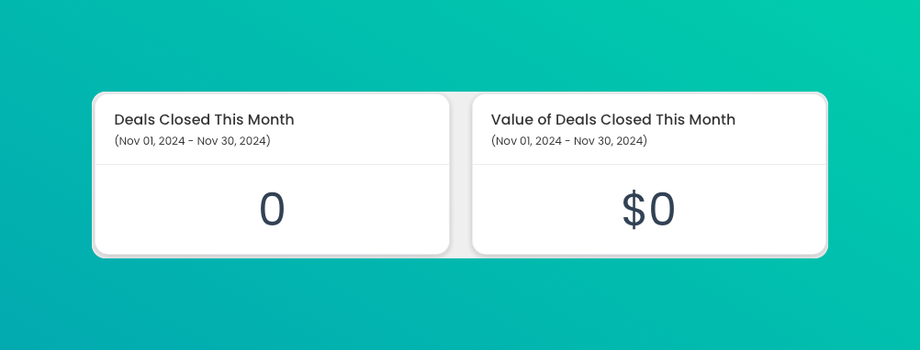
2. Deals Closed This Month and Value of Deals Closed This Month
• A quick view of the deals successfully closed, allowing you to track conversions and celebrate wins and its value.
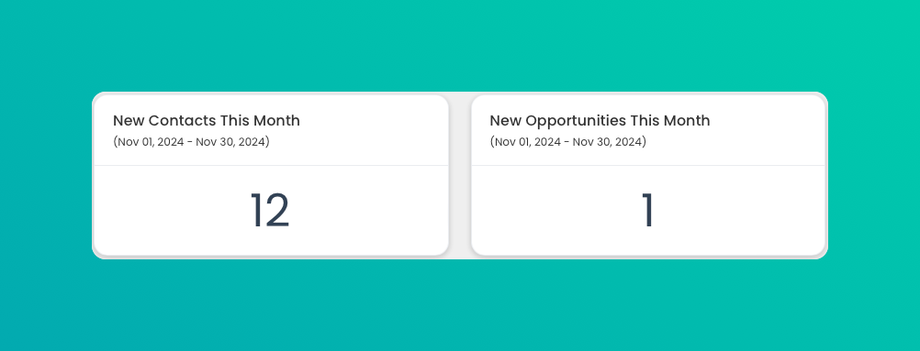
3. New Contacts/Opportunities This Month
• Shows the number of new leads and opportunities generated within the current month.
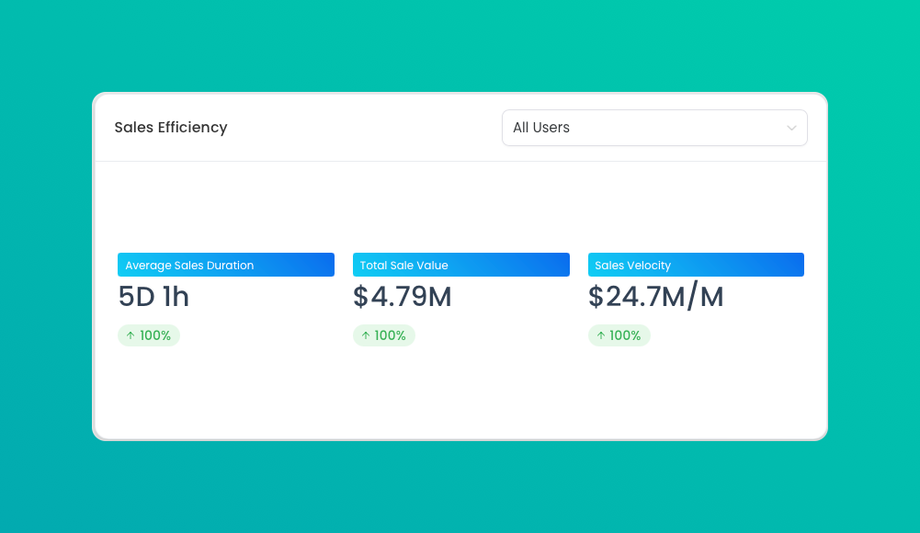
4. Sales Efficiency
• A metric displaying the efficiency of your sales efforts, often calculated by the ratio of closed deals to open opportunities.
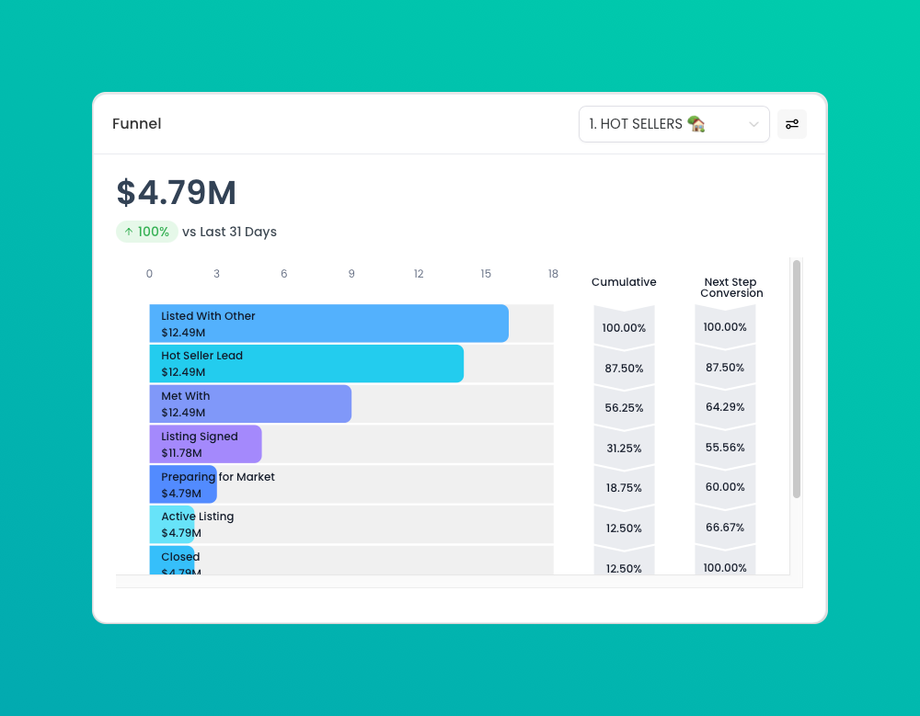
5. Sales Funnel
• A visual representation of your sales funnel stages, allowing you to see where opportunities are in the pipeline and identify bottlenecks.
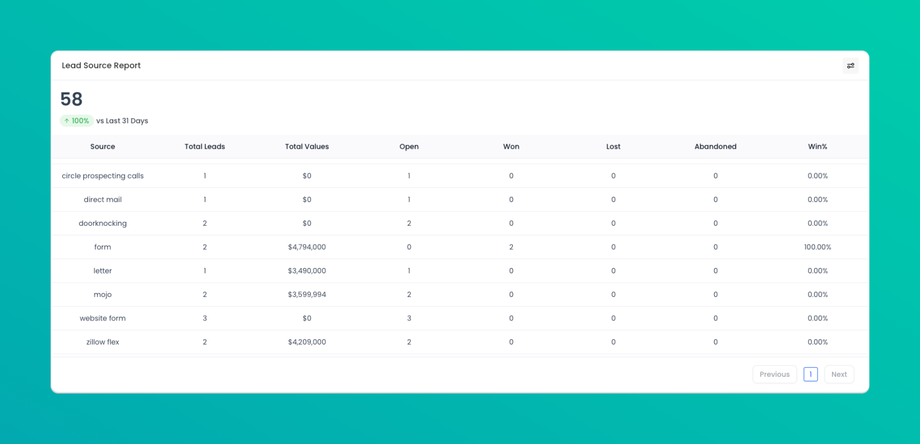
6. Lead Source Report
• An analysis of where your leads are coming from, enabling you to focus on high-performing channels and adjust marketing strategies as needed.
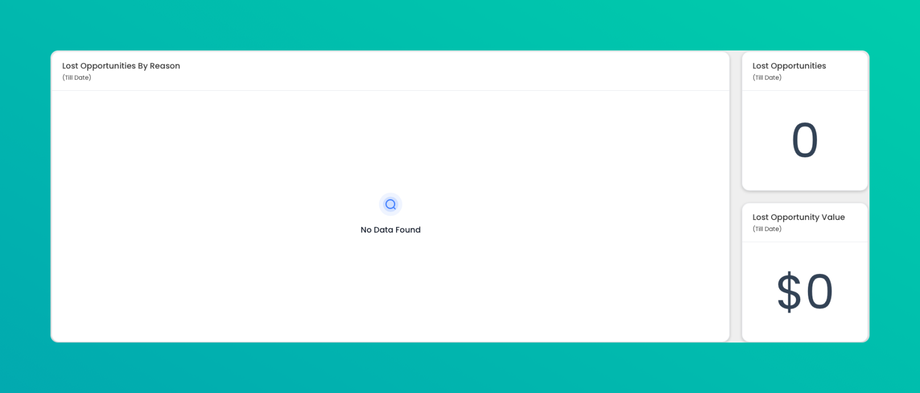
8. Lost Opportunities by Reason and Lost Opportunities Summary
• A breakdown of lost deals by reason, providing insights into common challenges or objections that need addressing. It also includes cards showing the total number of lost opportunities and the total value lost.


