📊 Custom Reports
The Custom Reports feature in DealTrail allows users to create, configure, and analyze reports tailored to their specific business needs. With Custom Reports, you can track performance metrics, visualize data, and gain actionable insights from your DealTrail account.
1. Accessing Custom Reports
To create and manage custom reports, follow these steps:
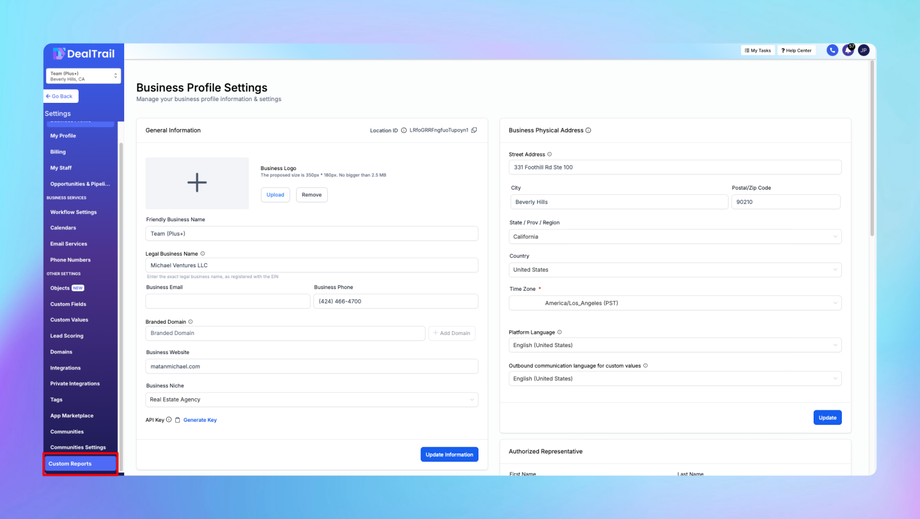
1. Navigate to Settings > Custom Reports.
2. On the Custom Reports Dashboard, you will see:
• Existing Reports: A list of previously created reports.
• Create New Report: An option to build a new custom report from scratch.
2. Creating a Custom Report
Steps to Create a New Report:
1. Click on “Create New Report”:
• This opens the report builder interface.
2. Select a Data Source:
• Choose the type of data you want to report on, such as:
• Contacts: Track leads and customer data.
• Opportunities: Analyze pipeline performance.
• Payments: Monitor revenue and transaction details.
• Marketing: View email, SMS, and ad campaign performance.
• Appointments: Measure scheduling and attendance rates.
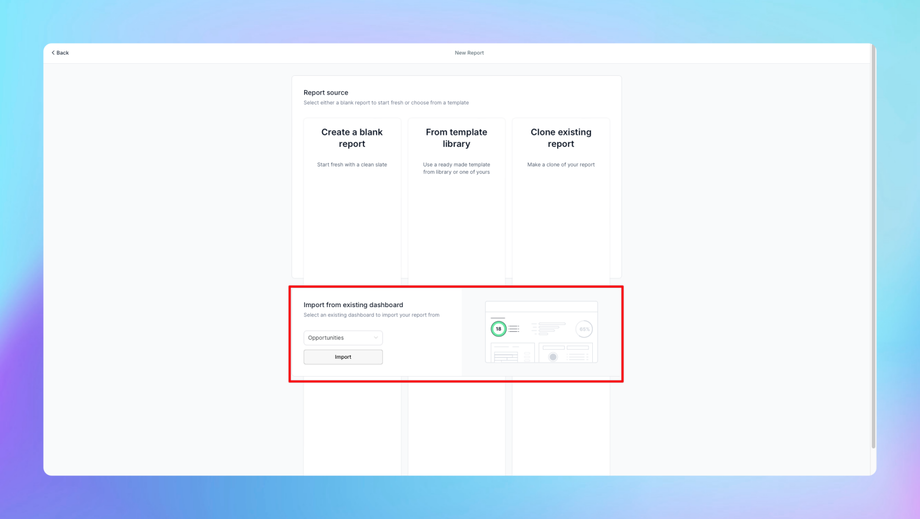
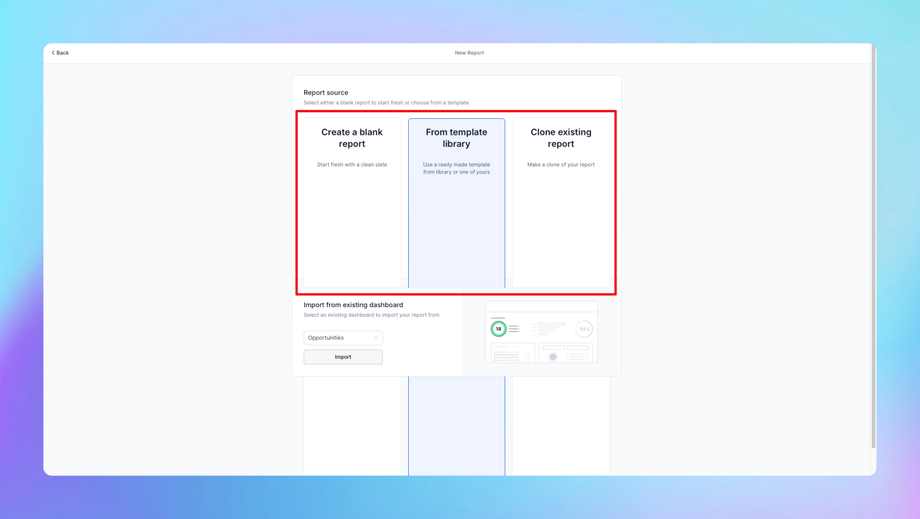
3. Choose a Template (Optional):
• Start with a pre-built template if available (e.g., “Pipeline Conversion Summary”).
• Alternatively, select Blank Report to build from scratch.
Configuring the Report:
1. Add Metrics:
• Metrics are the data points you want to measure (e.g., “Total Leads,” “Email Open Rate,” “Revenue”).
• Click + Add Metric to select metrics relevant to your report.
2. Apply Filters:
• Use filters to narrow down the data (e.g., filter by date range, specific pipeline stages, or tags).
• Example: For a lead report, filter by “Lead Source” to see how leads are distributed across campaigns.
3. Group Data:
• Group your data by categories such as “Month,” “Pipeline Stage,” or “Team Member.”
• Example: Group payments by month to analyze monthly revenue trends.
4. Choose Visualization Type:
• Select how the data will be displayed:
• Table: For raw data.
• Bar Chart: For comparing categories.
• Line Chart: For tracking trends over time.
• Pie Chart: For percentage breakdowns.
5. Preview and Save:
• Use the Preview option to ensure the report looks as expected.
• Click Save Report and provide a descriptive name for easy identification.
3. Editing and Managing Custom Reports
Steps to Edit a Report:
1. Navigate to Settings > Custom Reports.
2. Locate the report you want to edit and click the Edit (pencil icon).
3. Make updates to metrics, filters, or visualization options.
4. Save the changes to update the report.
Steps to Delete a Report:
1. Find the report in your Custom Reports list.
2. Click the Delete (trash icon).
3. Confirm the deletion.
4. Scheduling and Sharing Reports
Scheduling Reports:
You can set up recurring schedules to automatically generate and share reports.
1. Open the Report:
• Go to Settings > Custom Reports > Select the report.
2. Click “Schedule Report”:
• Set the frequency (e.g., daily, weekly, or monthly).
3. Choose Delivery Method:
• Select how the report will be delivered:
• Email: Send the report to specific team members or external clients.
• Download: Automatically generate and store the report as a file in DealTrail.
4. Set Recipients:
• Add team members’ or clients’ email addresses.
5. Save Schedule:
• The report will now be generated and sent based on your schedule.\
Sharing Reports:
You can manually share reports with stakeholders.
1. Open the Report:
• Navigate to Settings > Custom Reports > Select the report.
2. Click “Share Report”:
• Copy the report link or email it directly to recipients.
• Use permissions to control who can view the report (e.g., restrict to team members only).
5. Custom Reports Templates
DealTrail provides a range of pre-built templates to make creating reports easier.
Popular Templates:
1. Pipeline Conversion Summary:
• Tracks the conversion rate of leads through different pipeline stages.
2. Revenue Overview:
• Displays monthly revenue, total payments, and payment sources.
3. Email Campaign Performance:
• Shows email open rates, click rates, and bounce rates for your campaigns.
4. Appointment Metrics:
• Tracks appointment booking rates, no-show percentages, and attended appointments.
How to Use a Template:
1. Go to Settings > Custom Reports > Create New Report.
2. Select a Template from the list.
3. Customize it by adding additional metrics or filters as needed.
4. Save and schedule the report.
6. Visualization Options
Custom Reports offer multiple visualization options to present data in a meaningful way:
1. Tables:
• For detailed breakdowns (e.g., all leads generated by specific campaigns).
2. Bar Charts:
• Compare different categories (e.g., revenue by product type).
3. Line Charts:
• Highlight trends over time (e.g., lead volume over the past 6 months).
4. Pie Charts:
• Show percentage-based distributions (e.g., leads by source).
Tip: Choose the visualization that best matches the type of data you’re presenting.
7. Best Practices for Custom Reports
1. Start with Key Metrics:
• Focus on the data points that matter most for your business objectives.
• Example: For sales, start with metrics like “Closed Deals” and “Pipeline Conversion Rate.”
2. Use Filters Effectively:
• Apply filters to refine your reports for specific audiences or purposes.
• Example: Filter by team members to track individual performance.
3. Group Data for Clarity:
• Group data by time periods, categories, or user roles for easier analysis.
• Example: Group revenue by month to identify growth trends.
4. Schedule Reports for Automation:
• Use scheduled reports to reduce manual work and keep stakeholders informed regularly.
5. Test and Iterate:
• Create test reports to experiment with different metrics and visualizations.
• Adjust reports based on feedback or new business requirements.
FAQs
Q: What data sources can I use in Custom Reports?
A: You can pull data from:
• Contacts
• Opportunities (Pipeline stages)
• Payments
• Marketing campaigns (email, SMS, ads)
• Appointments
Q: Can I share reports with external clients?
A: Yes, you can share reports via email or generate a shareable link. Make sure to adjust permissions to control who can access the data.
Q: How many reports can I create?
A: DealTrail does not impose strict limits on the number of reports, but it’s best to keep your reports organized and relevant.
Q: Can I export custom reports?
A: Yes, you can export reports in formats like CSV or PDF for offline sharing or analysis.
Q: What happens if I need to update a scheduled report?
A: Simply edit the report, and the updated version will be used for future scheduled deliveries.


